

Graphs are the first element that we will deal with in this tutorial. Graphs are one of the four elements that can be added to a report. There are two ways to add a graph to a report, we will go through both methods.
There are two ways to add a chart to an existing report. You add general graphs via Dashboards, and add specific graphs from the relevant graph yourself elsewhere in VendorLink. A general graph is a graph that does not depend on an entity (commodity, supplier, cost center, etc.).
Add a graph via Dashboards
Follow the instructions below to add a graph from the Dashboards side panel.
- Open the report where you want to add the graph.
- In the menu on the left, click Charts to open the chart list.
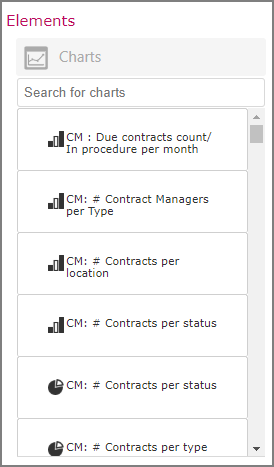
- Double click on the desired graph. You can also drag and drop it into the report.
Adding a graph from other VendorLink modules
The moment you want to add an entity-specific graph to a report, you do this from the location within VendorLink where the relevant graph is located.
- Navigate to the graph you with to add to your report.
- In the top right corner of the graph, click the report icon
 .
. - A pop-up window appears with all available reports. Select your report by clicking it once, and then click 'Add'.
- Navigate to Dashboards, and open the appropriate report to view the new layout of your report.